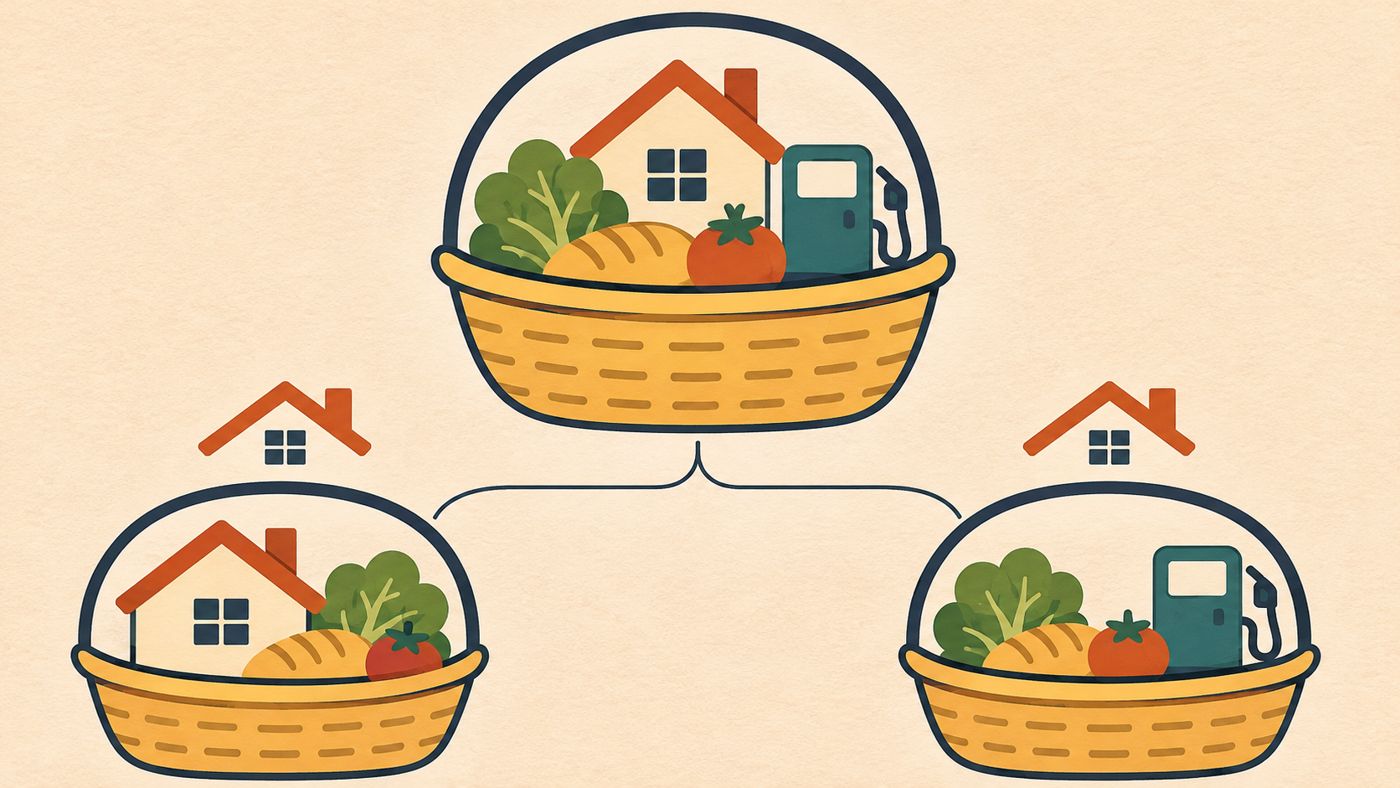
You hear that inflation is a certain percentage, yet your own bills seem to have moved by more, or less. Both can be true. The headline number is an average across all households, and your budget probably doesn't look like the average.
What does the inflation figure actually measure?
Inflation is a broad increase in the prices of goods and services, not a rise in one item. Some prices rise while others fall, and the index tracks the overall movement.
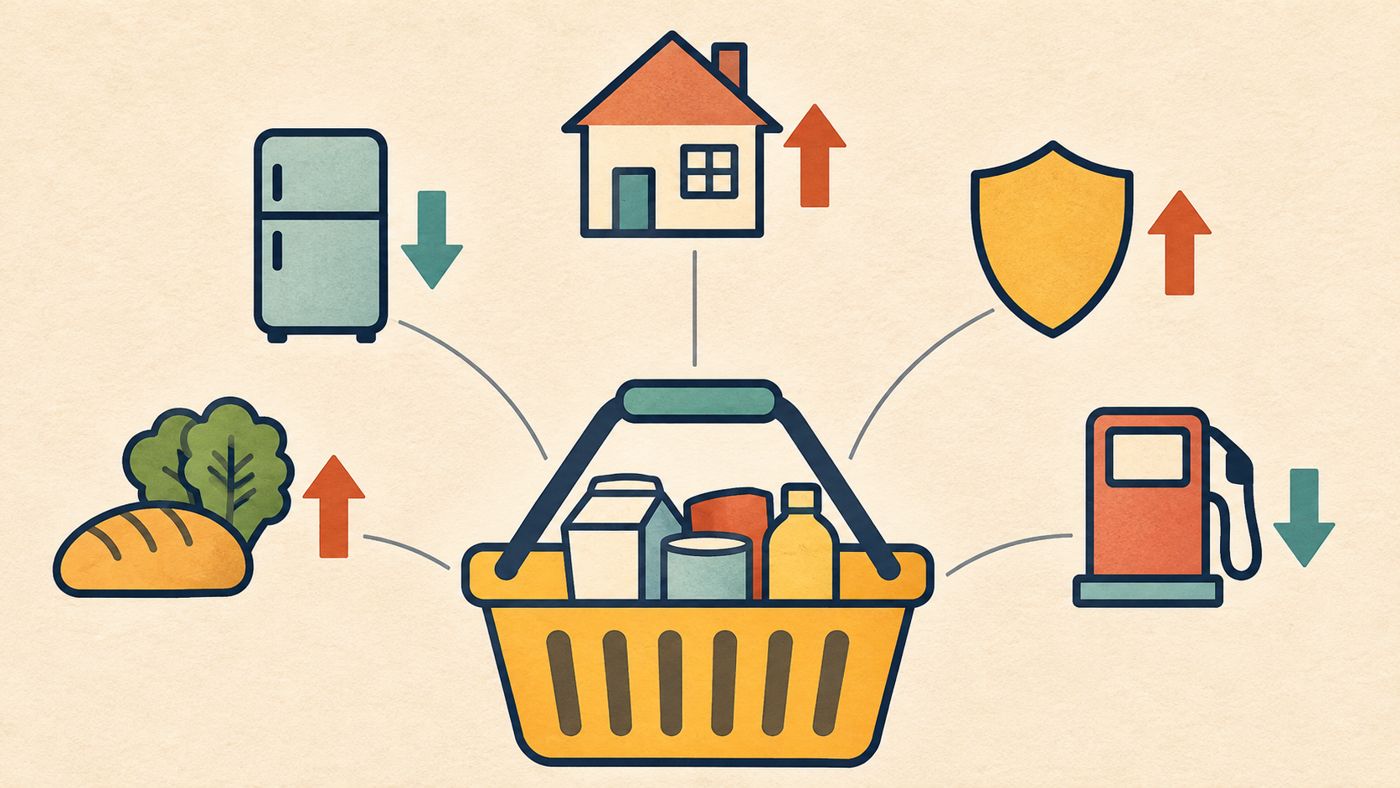
Statisticians do this with a "basket" of goods and services that households buy: everyday items, durable goods and services such as insurance and rent. The annual rate compares the cost of that basket in one month with its cost in the same month a year earlier.
The ECB's explainer describes the euro area's version, which is a useful guide to the general method. Australia's own index has its own design, so the details below are about the principle, not Australian numbers.
Why do some prices count for more than others?
Each item's influence depends on how much households spend on it. The ECB explains that products with a bigger share of spending get a greater weight than products with a smaller share.
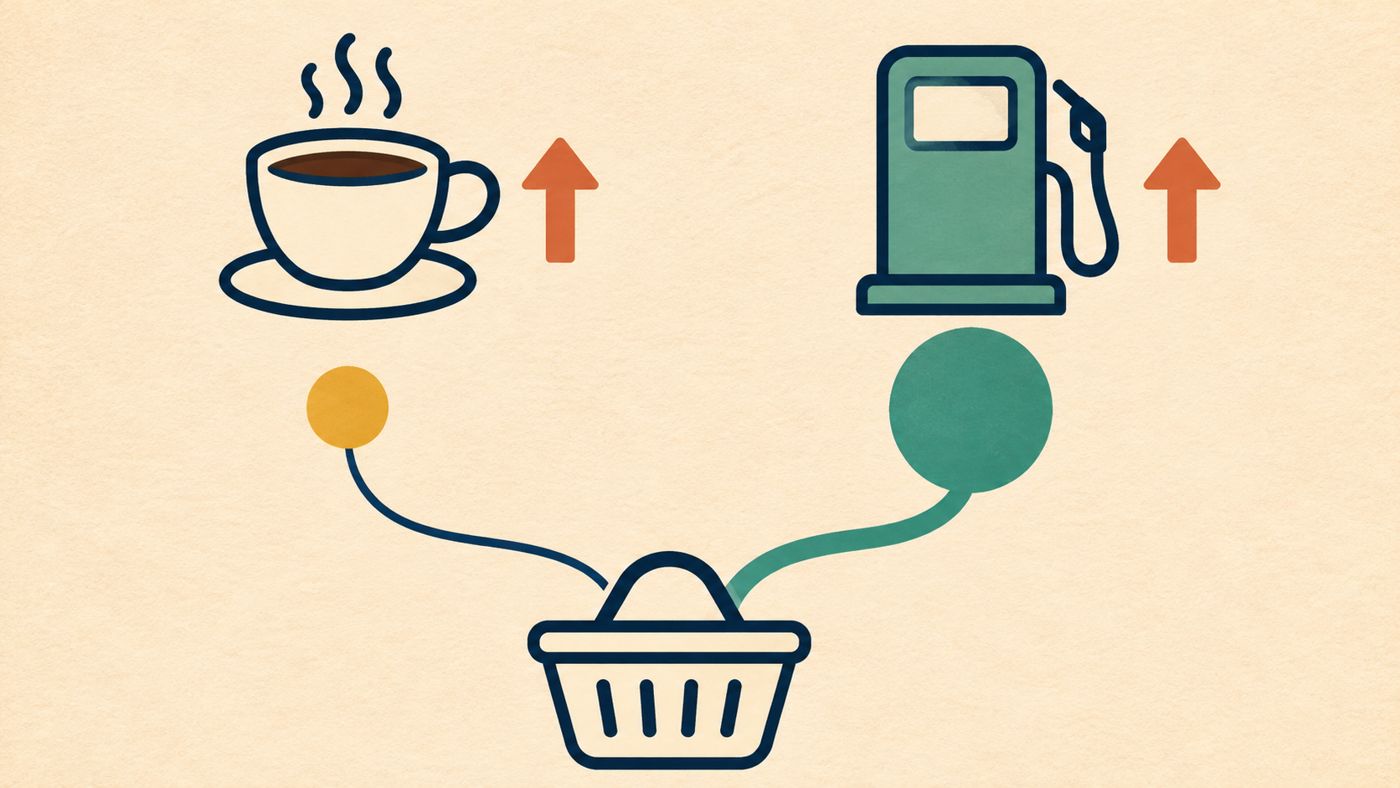
Its euro area examples: coffee, tea and cocoa carry a weight of 0.4%, while petrol and other car fuels carry 4.6%. The same percentage price change in petrol therefore moves the overall index about ten times as much as coffee does. Those weights belong to the euro area and aren't Australian figures.
The weights come from household spending surveys and are updated regularly so the index keeps up with changing habits.
How can your rate differ from the average? A hypothetical example
The numbers below are invented to show the mechanics. They aren't observed Australian data.
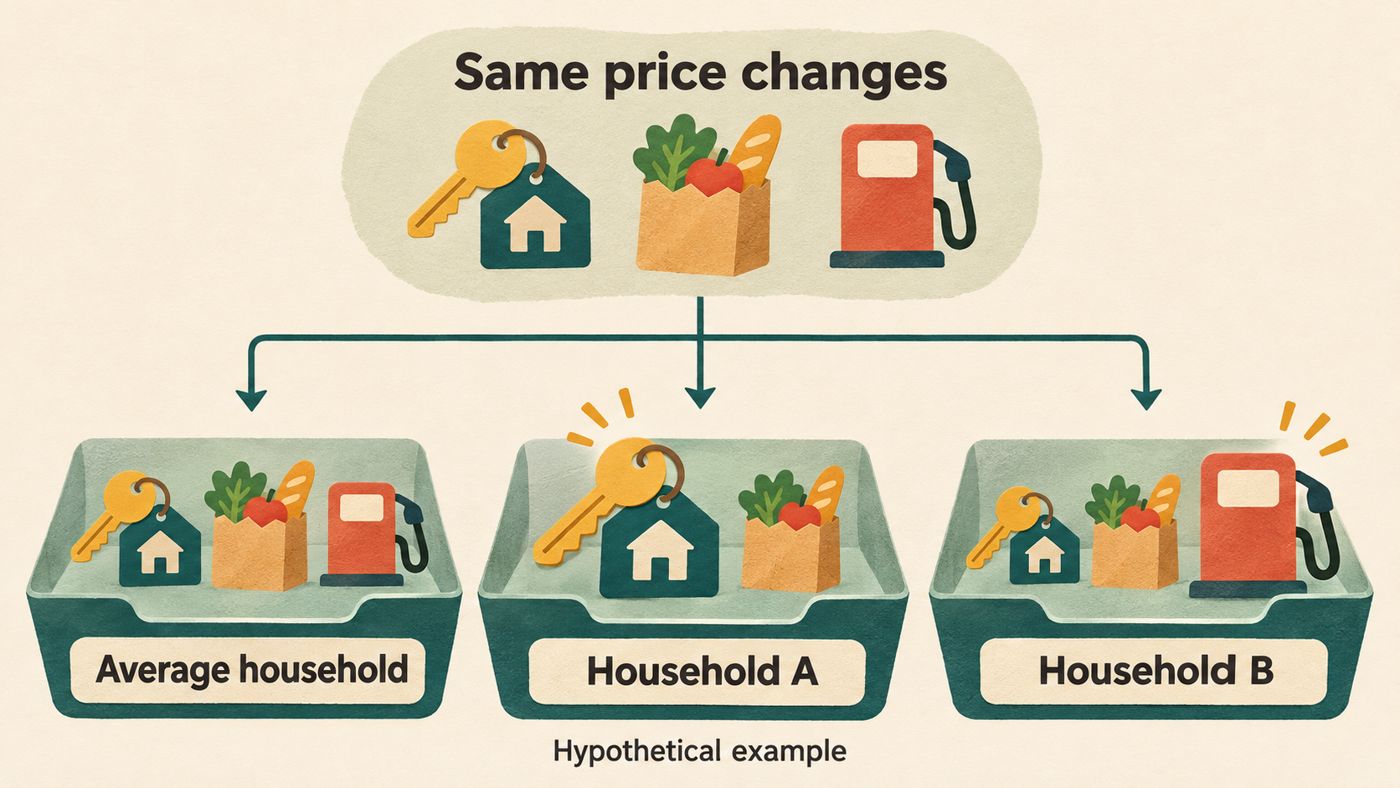
Suppose the "average household" spends 50% of its budget on rent, 30% on groceries and 20% on petrol. Over a year, rent rises 4%, groceries 2% and petrol 10%.
- Average household: (0.5 × 4) + (0.3 × 2) + (0.2 × 10) = 2.0 + 0.6 + 2.0 = 4.6%
- Household A (no car, rent is 70% of spending, groceries 30%): 2.8 + 0.6 = 3.4%
- Household B (drives a lot: rent 30%, groceries 30%, petrol 40%): 1.2 + 0.6 + 4.0 = 5.8%
Same prices, three different experiences. Nobody in this example is wrong. Each household's personal rate simply reflects what it buys.
This is a simplified weighted average. Real indexes handle many more categories and more detailed adjustments.
Is a lower inflation rate the same as lower prices?
No. The ECB's worked example shows a basket costing €850, then €875, then €891. The price index goes 100.0, 102.9, 104.8, so inflation is 2.9% and then 1.8%.
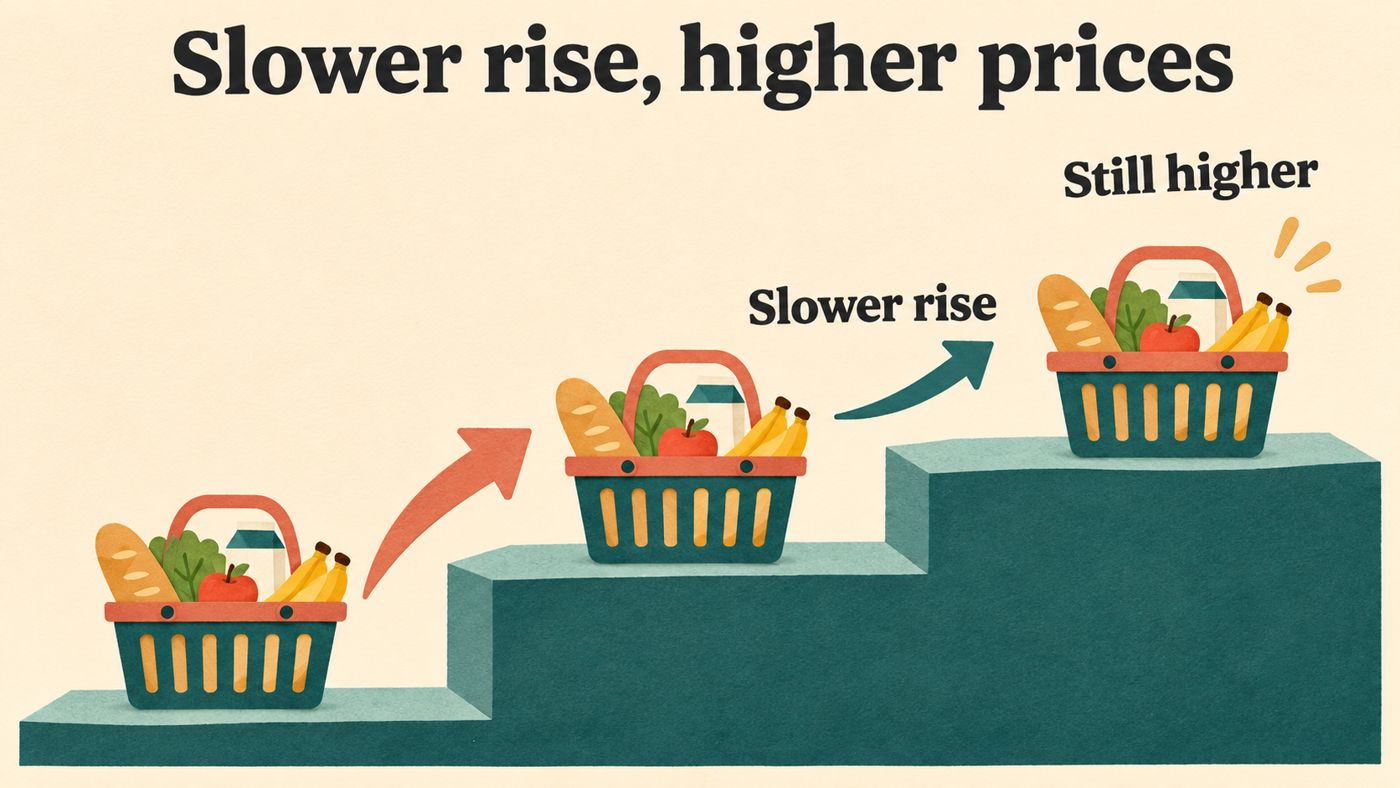
The rate slowed, but the price level still rose both years. When a news report says inflation is "easing", it usually means prices are climbing more slowly, not that they've come back down.
This also explains why a budget can still feel tight after the rate drops. The cost of living sits on the accumulated price level, not just the latest annual change.
Where does an average mislead?
A few conditions affect how well the headline fits you:
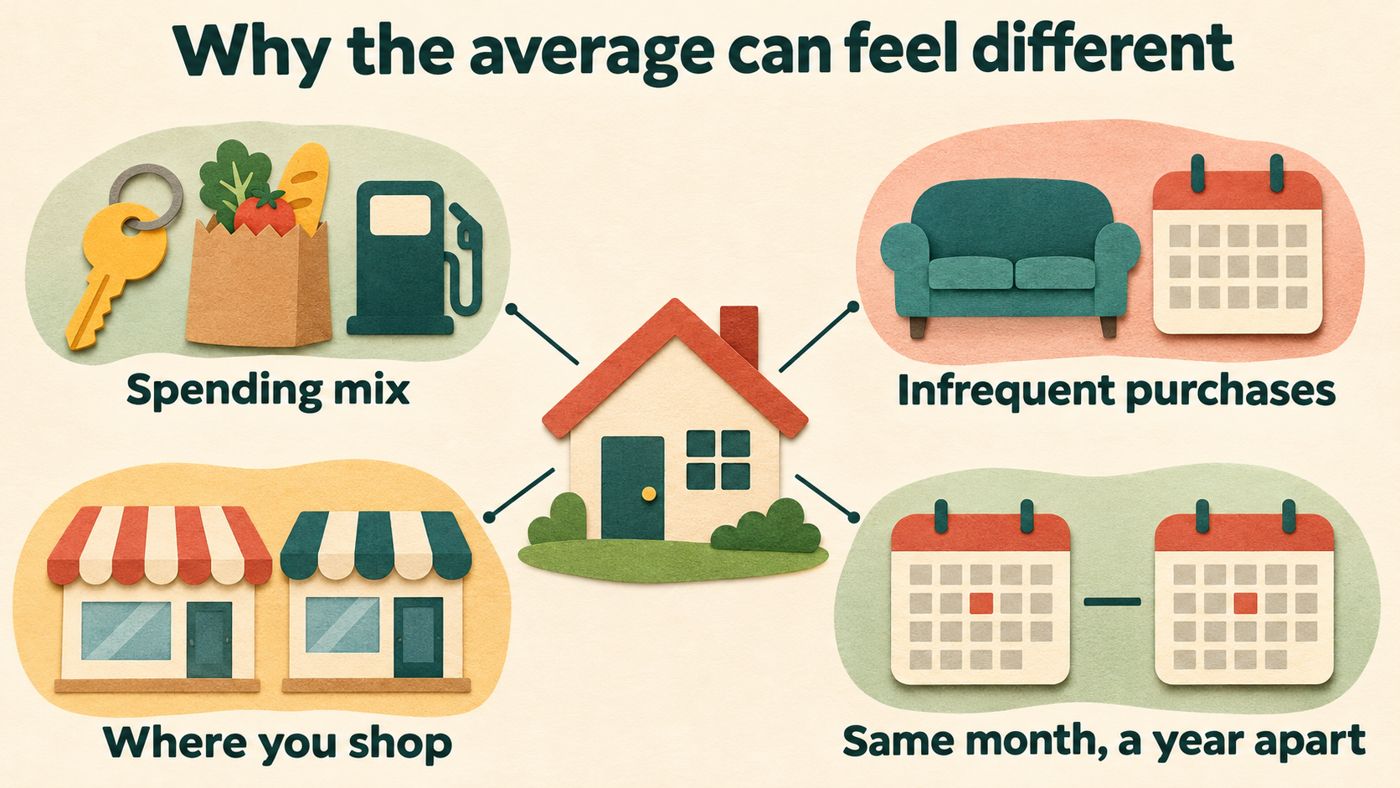
- Your spending mix. Renters, car owners, people with children and retirees can have quite different baskets. The ECB notes that every household has different spending habits, and the index weights reflect the combined average.
- Lumpy purchases. A big price rise in something you buy rarely may barely affect your year, but it still gets its average weight in the index.
- Where and how you shop. Prices are collected from many outlets and regions, so your local prices may move differently.
- Timing. An annual rate compares one month with the same month a year earlier. It doesn't tell you what happened in between.
How can you check Australia's version?
The ECB page covers the euro area's index, which is comparable across EU countries because they follow the same methodology. It doesn't describe how Australia builds its measure.
For local detail, go to the Australian Bureau of Statistics, the national statistics agency, and read its published methodology and the current spending weights for each category. Compare those weights with your own budget. A simple check is to list your last few months of spending as percentages and see where you sit relative to the published shares.
That gives you a more personal sense of what the headline means for you. This article is general education, not financial advice, and it makes no statement about current Australian inflation.